The Atlas of Disappearing Places
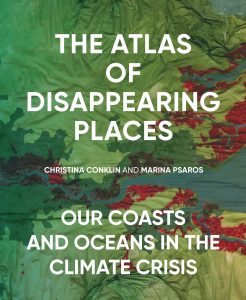 These images are from the book, The Atlas of Disappearing Places.
Around the globe, the climate crisis is manifesting in the ocean and along our coasts as stronger storms, warmer waters, chemical changes, and higher sea levels. In this atlas, we tell the stories of twenty places that are being impacted by these changes. Our stories explore the experiences, species, and ways of life that are disappearing, why these changes are happening, and what might come next in a climate-disrupted future.
As an artist and writer, Christina works at the intersection of nature and culture, often using the ocean as both site and metaphor. Her interactive art installations on health and illness in natural systems—including our own bodies—investigate process, relationship, and responsibility in this time of climatic and cultural upheaval. Her main interest is in exploring the complexity of our relationships with the living world and how much we have left to learn.
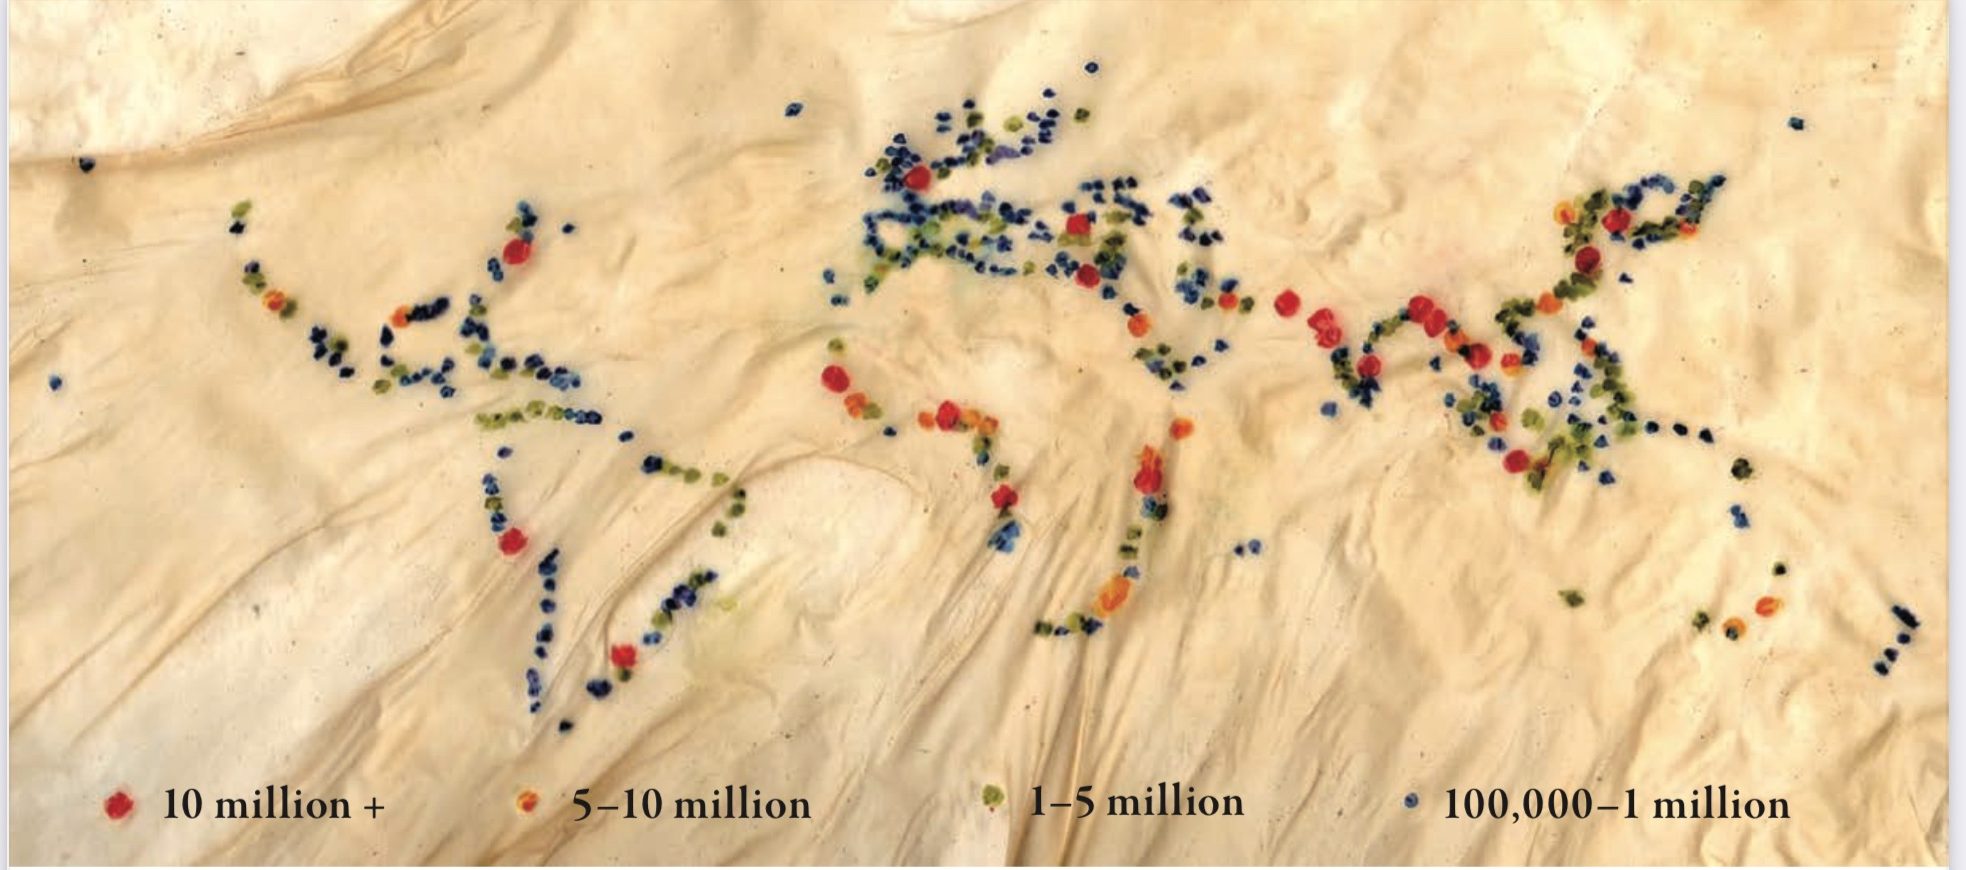
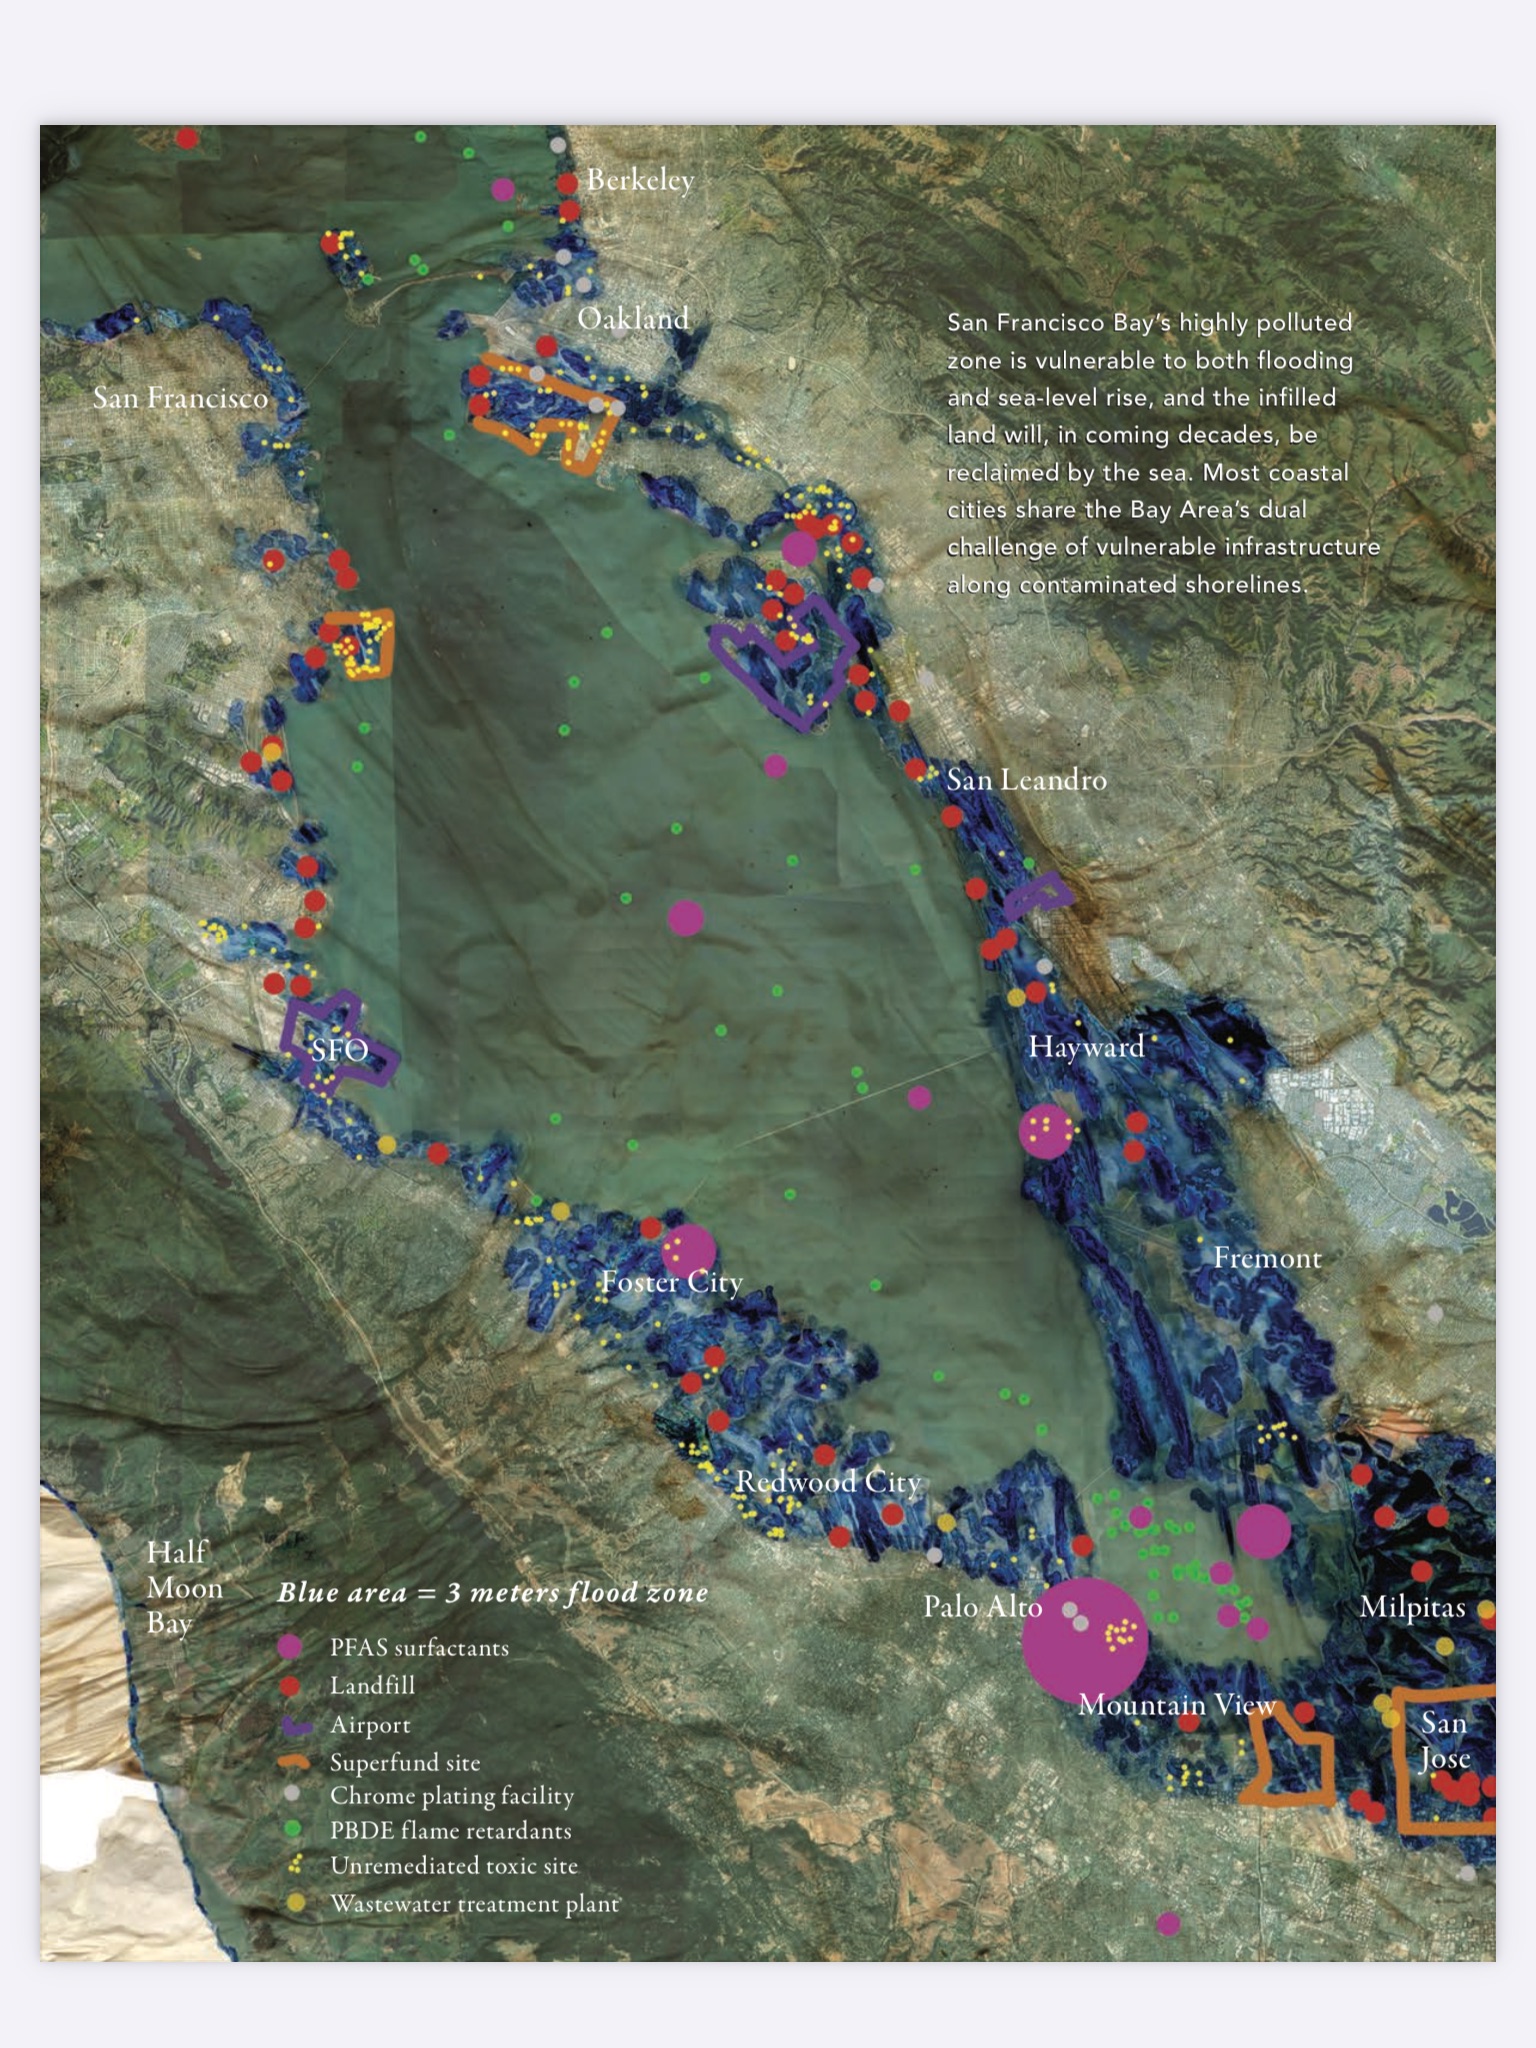
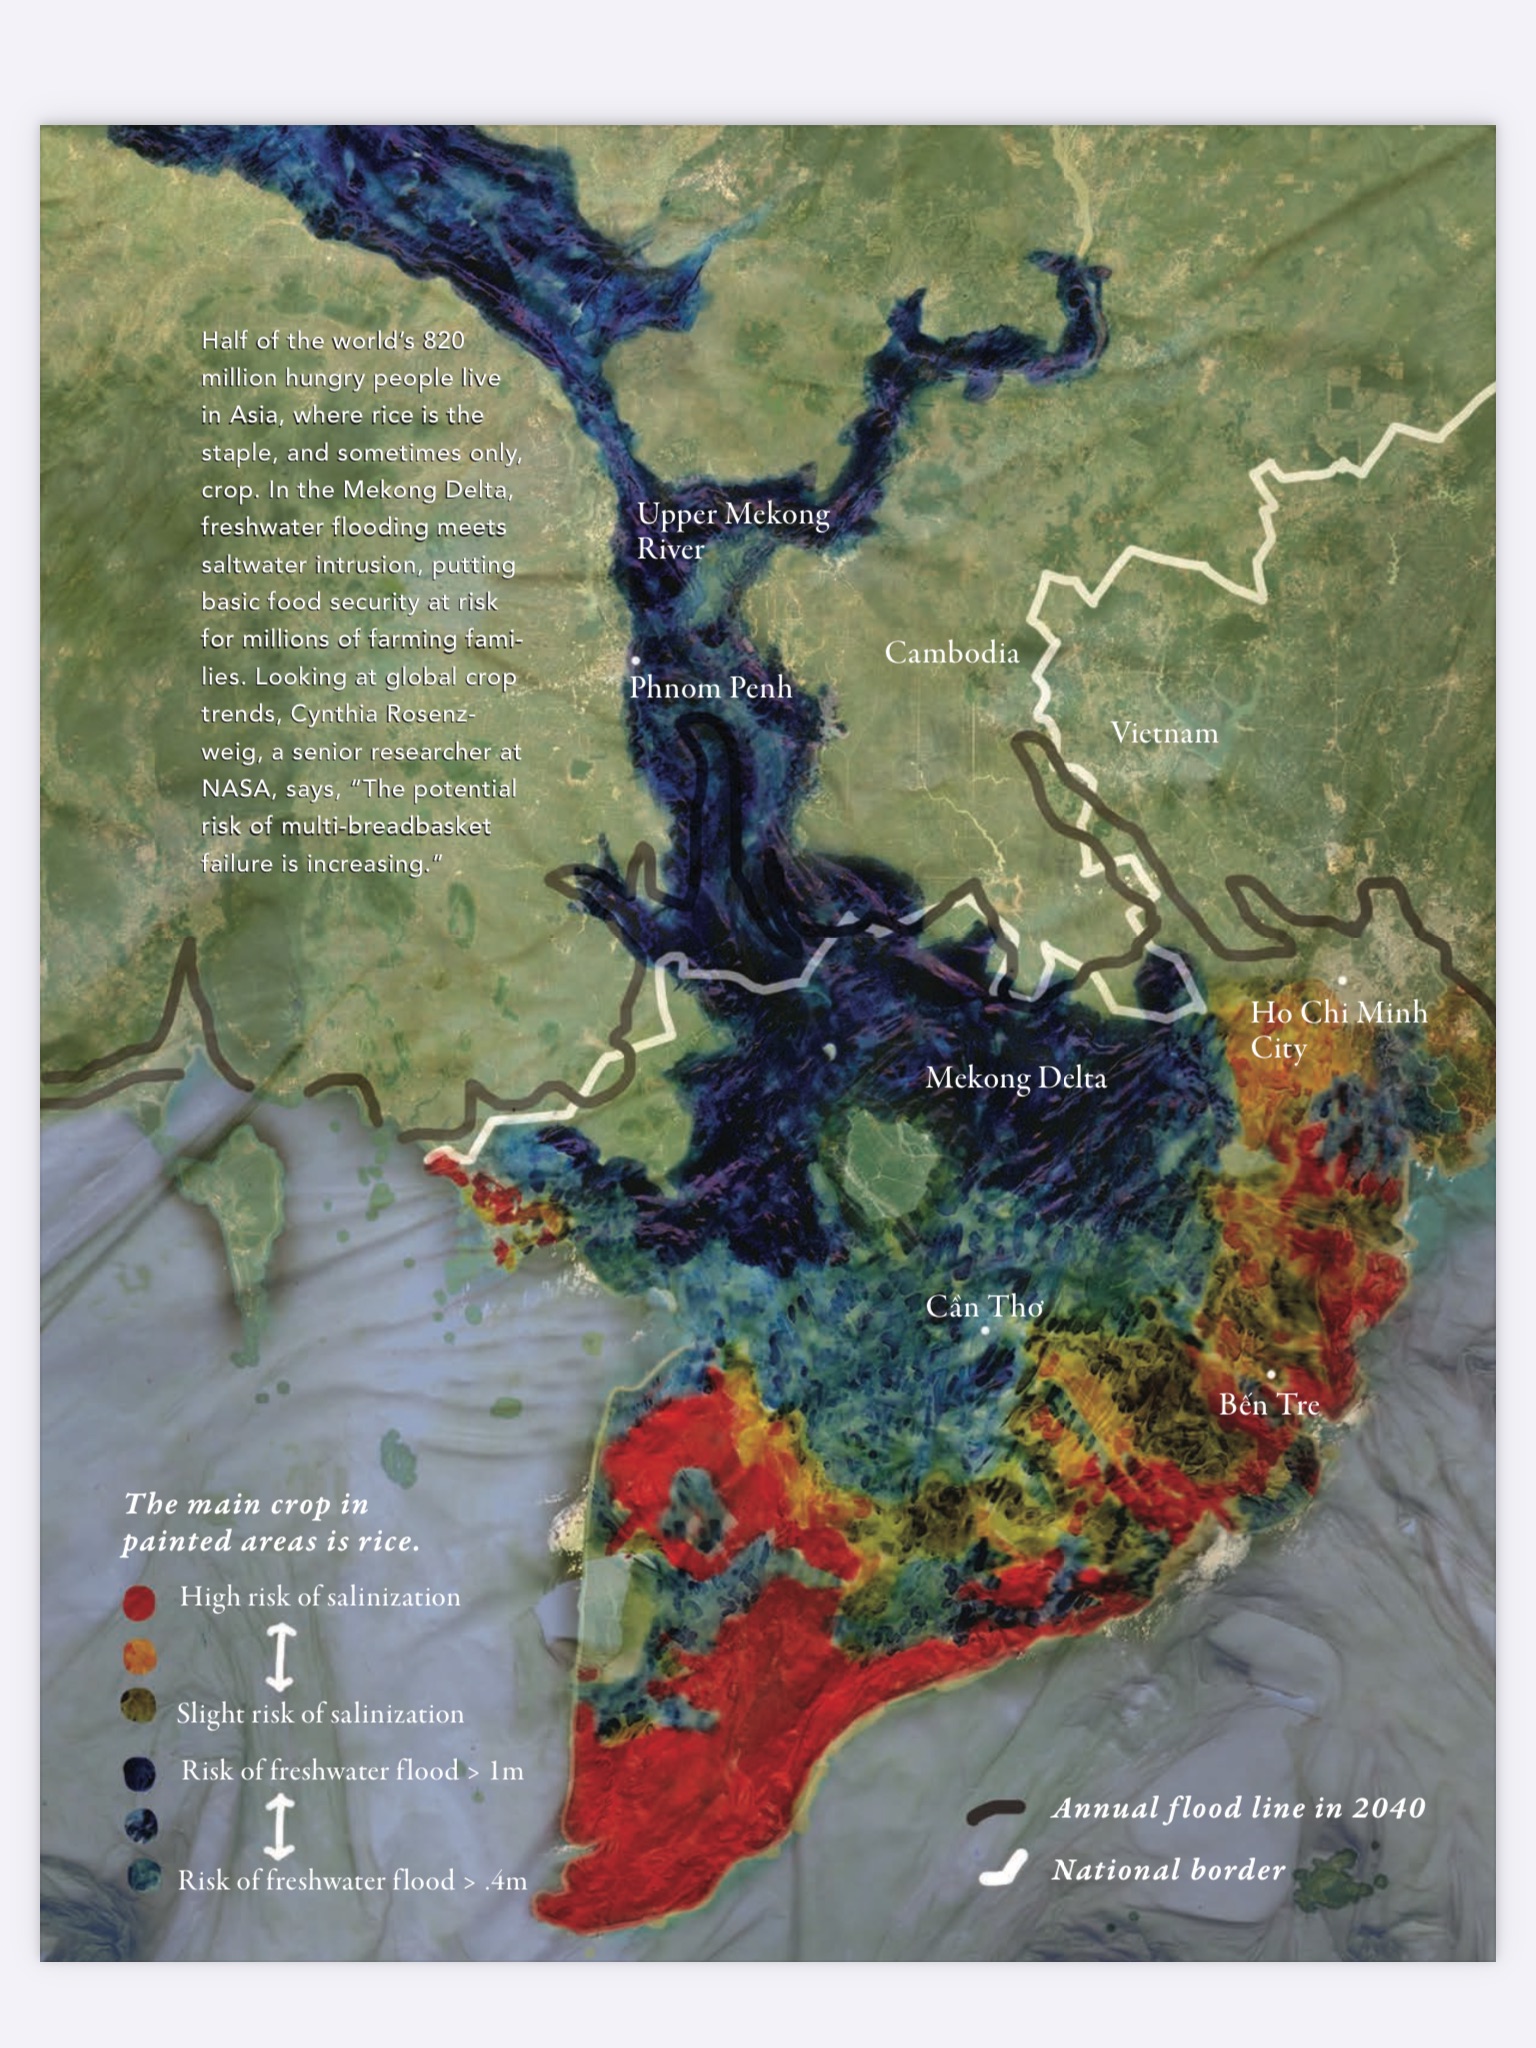
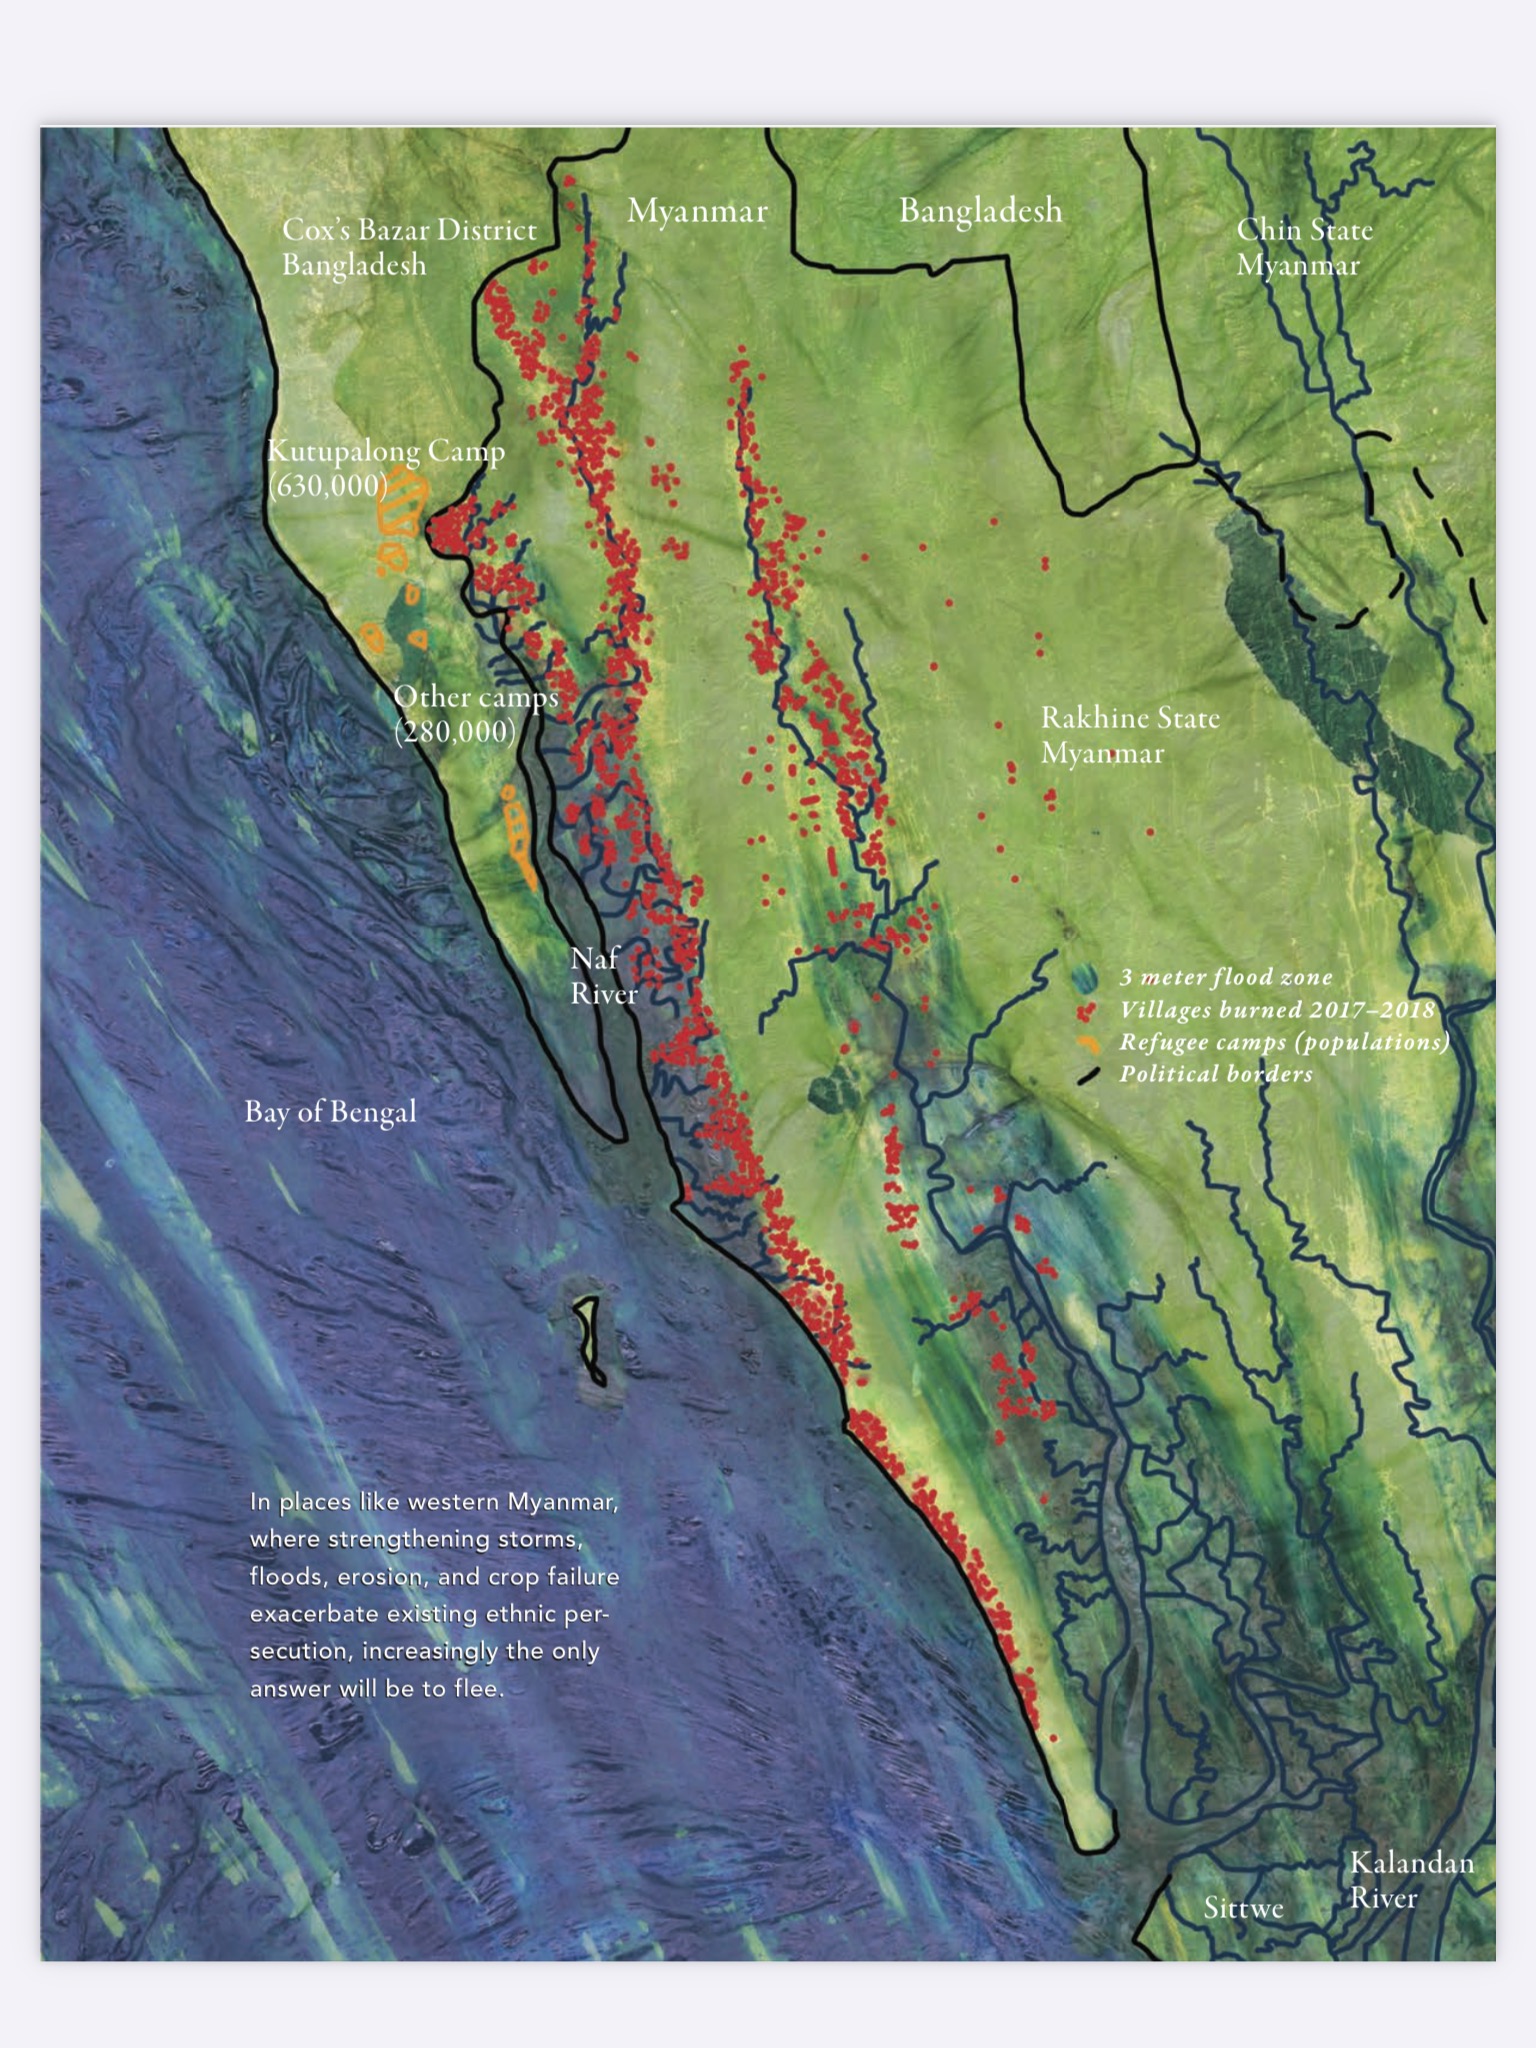
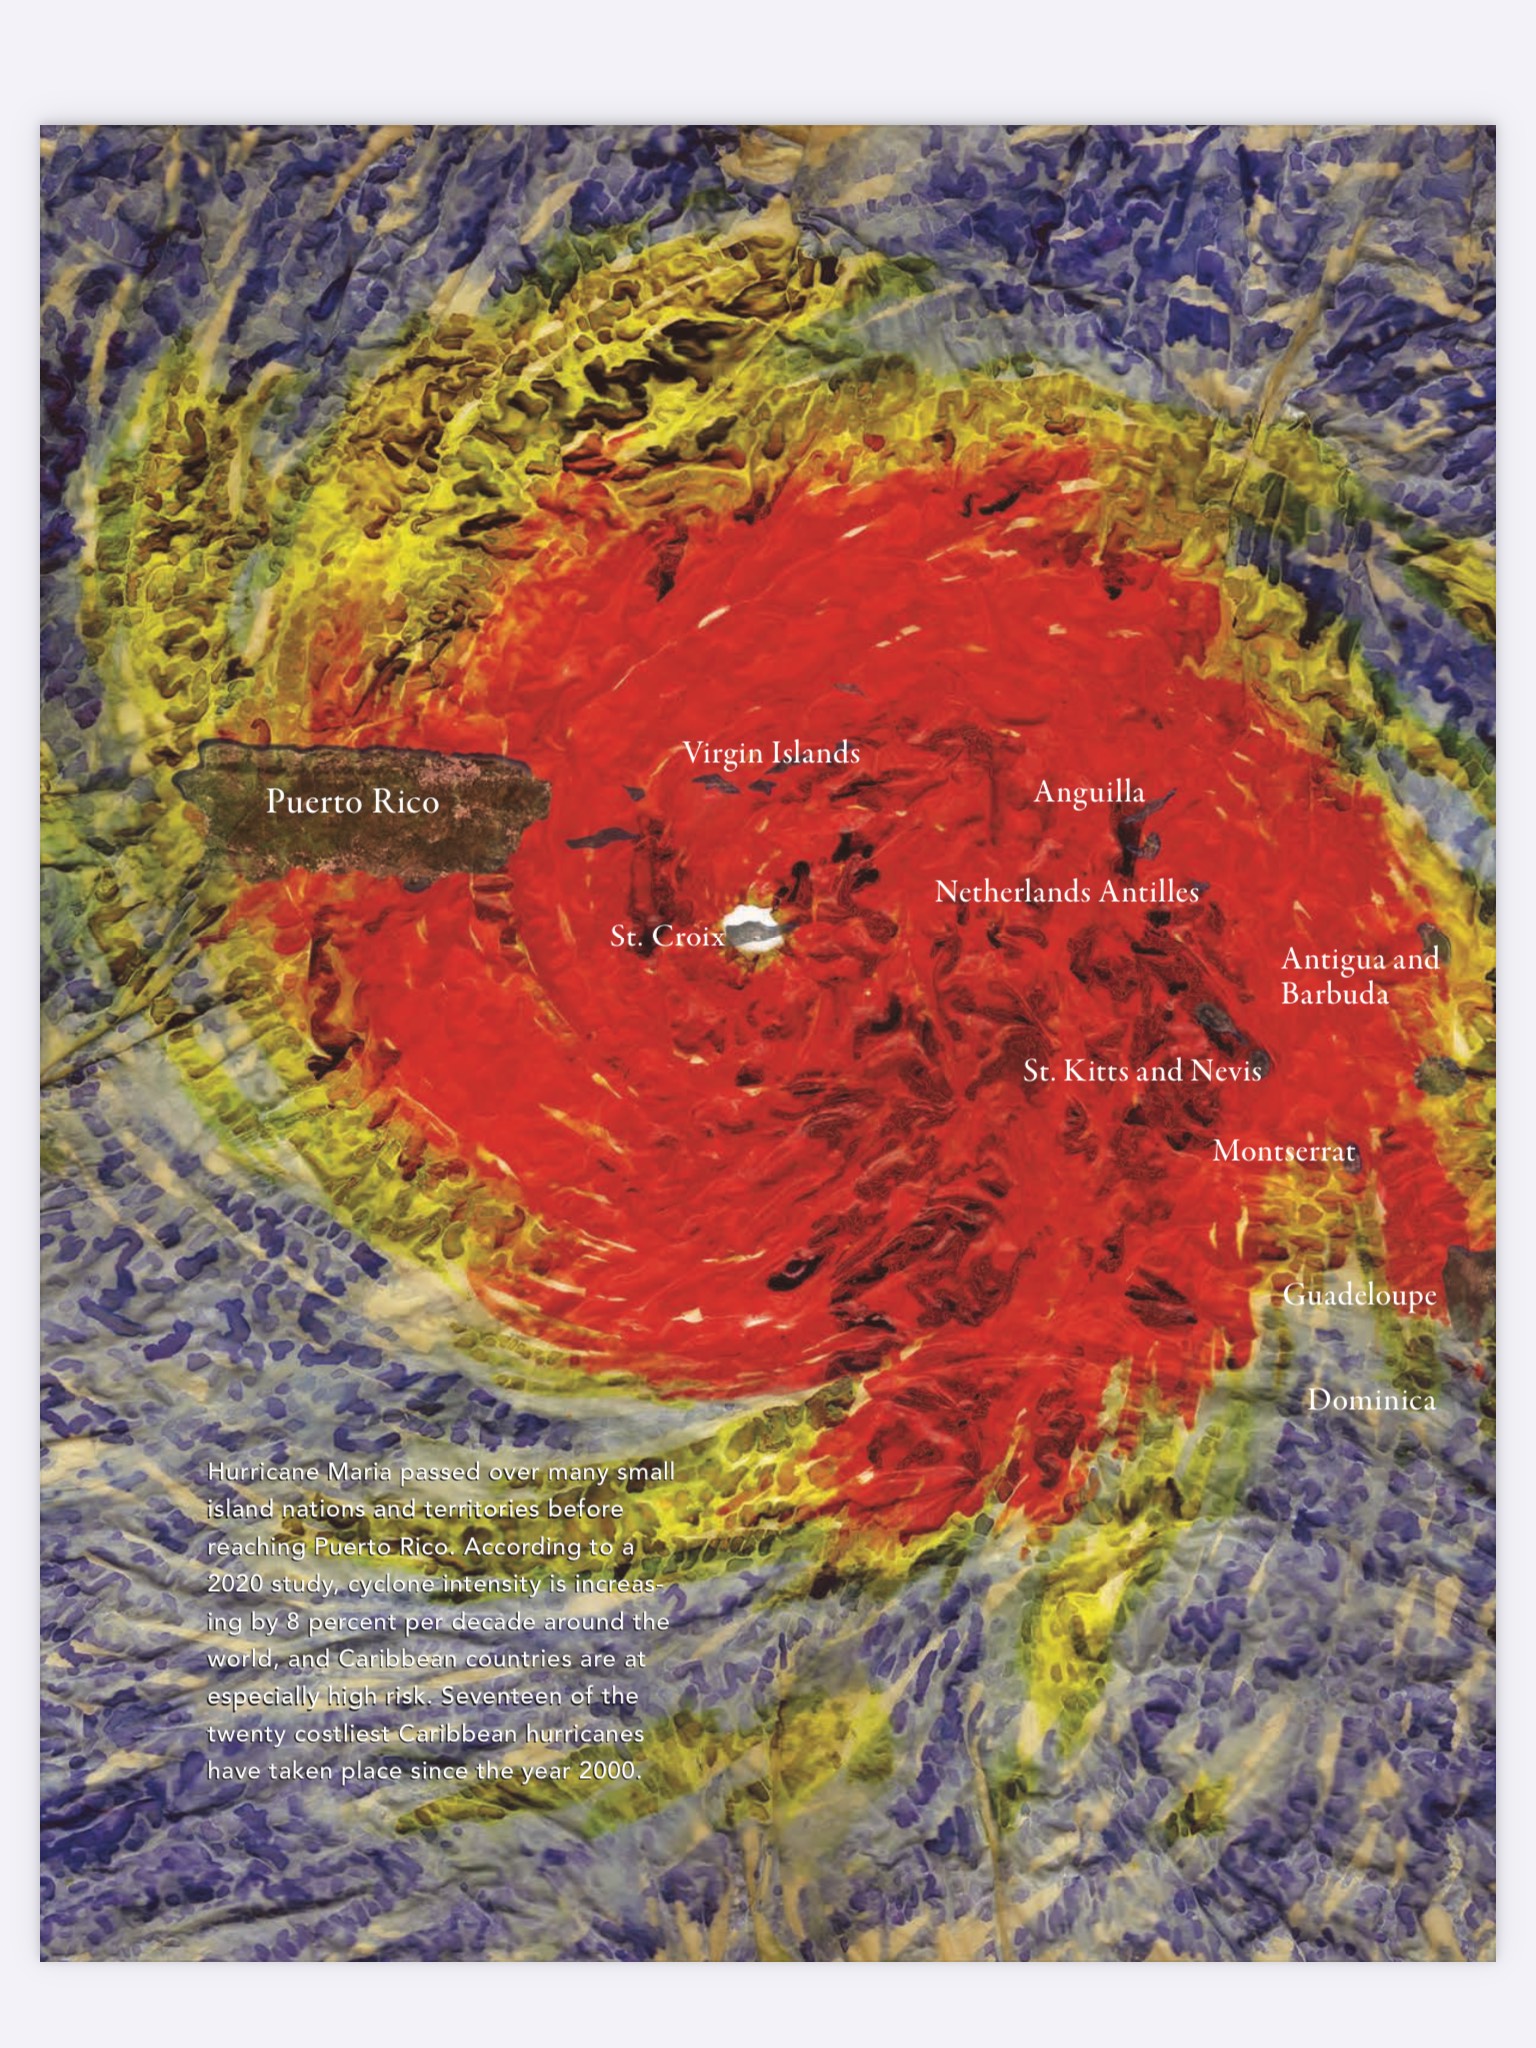
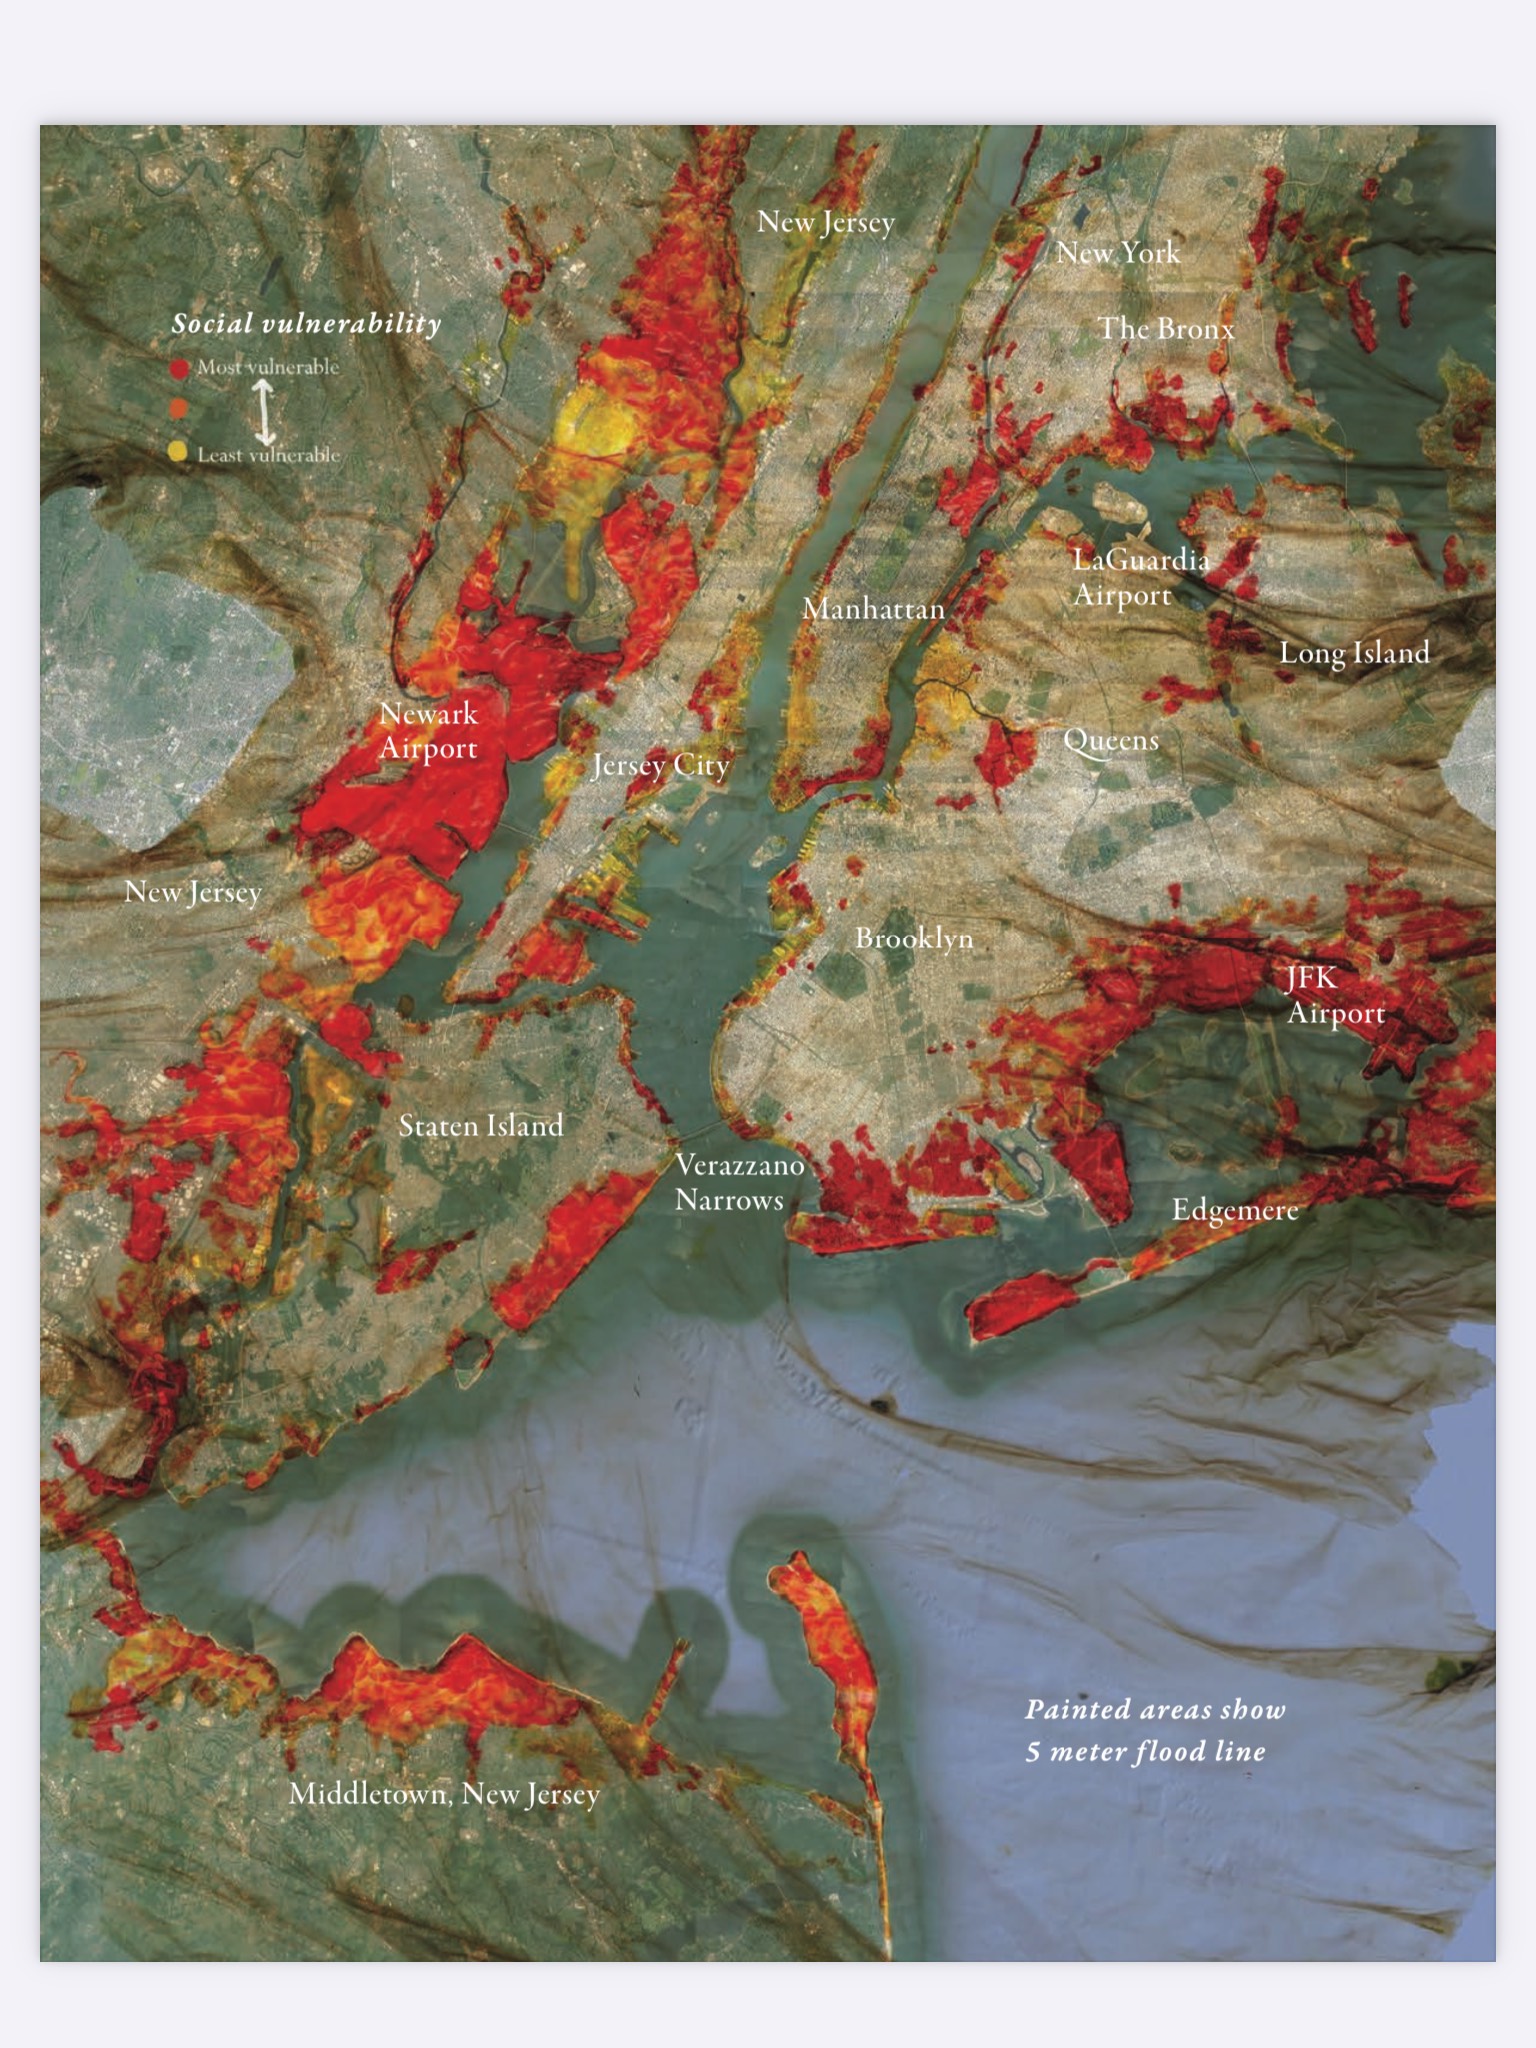
She painted these maps on sheets of dried “sea lettuce,” members of the genus Ulva, a group of green macroalgae found in many parts of the world. The process involves hauling forty pounds of wet, briny seaweed back to her studio and washing and laying each sheet out to dry in an iteration of “women’s work,” such as basketmaking or weaving, in which materials have to be seasonally gathered and processed before the artwork can be made. Only two cells thick, the green sheets of Ulva then bleach in the sun to a beautiful, translucent parchment that is brittle, fragile, and luminous.
Each map is painted with water-soluble inks. If water touches the ink, it will wash away. If the parchment gets wet, it will instantly reanimate into slippery, slimy sheets, and the map is gone, elusive as the passage of time. All of the maps in this book were created from a single piece of Ulva perhaps 150 square feet in size, the largest Christina has ever found. Each map is a re-creation of one or more published data sources from our research, using the color scheme shared by almost all researchers—red equals danger! Most of the seaweed images were then digitally layered onto a Google Earth image to provide geographical reference points. Most chapters also include smaller maps that show the global extent of each climate impact, replicating each researcher’s choice of map projection.
© Christina Conklin and Marina Psaros. This excerpt originally appeared in The Atlas of Disappearing Places: Our
Coasts and Oceans in the Climate Crisis, published by The New Press. Reprinted here with permission.


